On January 11, together we began the first chapter of the Seattle Squeeze and a new era of tough traffic in Seattle: The full three-week closure of SR 99 downtown. We knew the longest major highway closure in our region was going to be hard.
That’s why ahead of the closure, with our partners at WSDOT, King County Metro, Sound Transit, and the Port of Seattle, we did all we could to get ready – from expanding transit service to monitoring our roads 24/7 to installing temporary bus-only lanes.
We also asked you to step up: to change your habits to help reduce the number of cars traveling downtown and to make space on transit.
With the new SR 99 tunnel now open, we’ve been analyzing the data from the SR 99 closure to understand what went well, how we could have done better, and how we can keep the good changes going during the next chapter of the Seattle Squeeze. Chapter Two begins on March 23, when the Downtown Seattle Transit Tunnel transitions to light rail only operations and 830 more buses will begin traveling on our downtown streets.
That data is clear: Our entire region came together to take on this challenge and be part of the solution. People drove less, took transit, and biked more.
Good news: People drove less to and through our downtown.
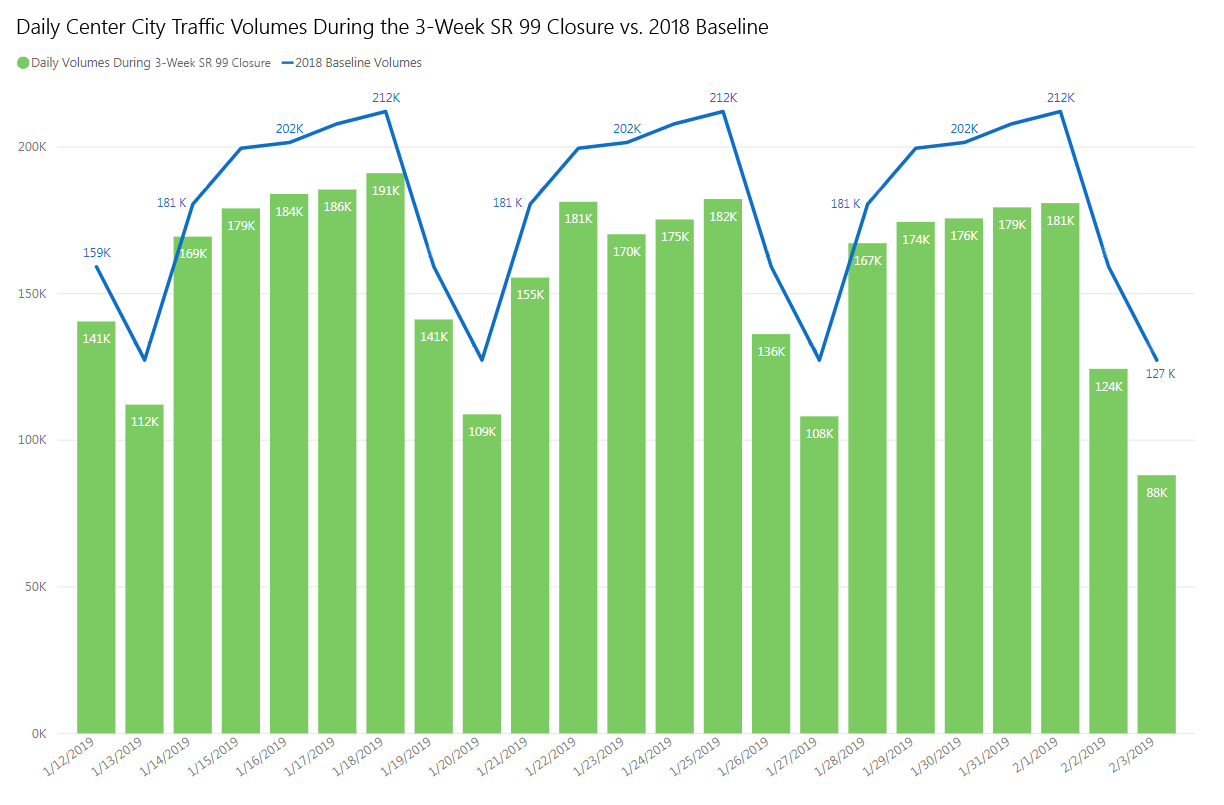
One of our key goals during the SR 99 closure was to prevent gridlock by having fewer cars downtown. One way we understand how many cars and buses are coming into our downtown is by counting them at key north and south arterials as they head into our “center city”; from the north, we count at Mercer Street, and from the south, at Holgate St. We then compared that data to a baseline period of September 2018 to understand the change.
The data shows that for every single day that SR 99 was closed, there were fewer vehicles driving into our downtown:
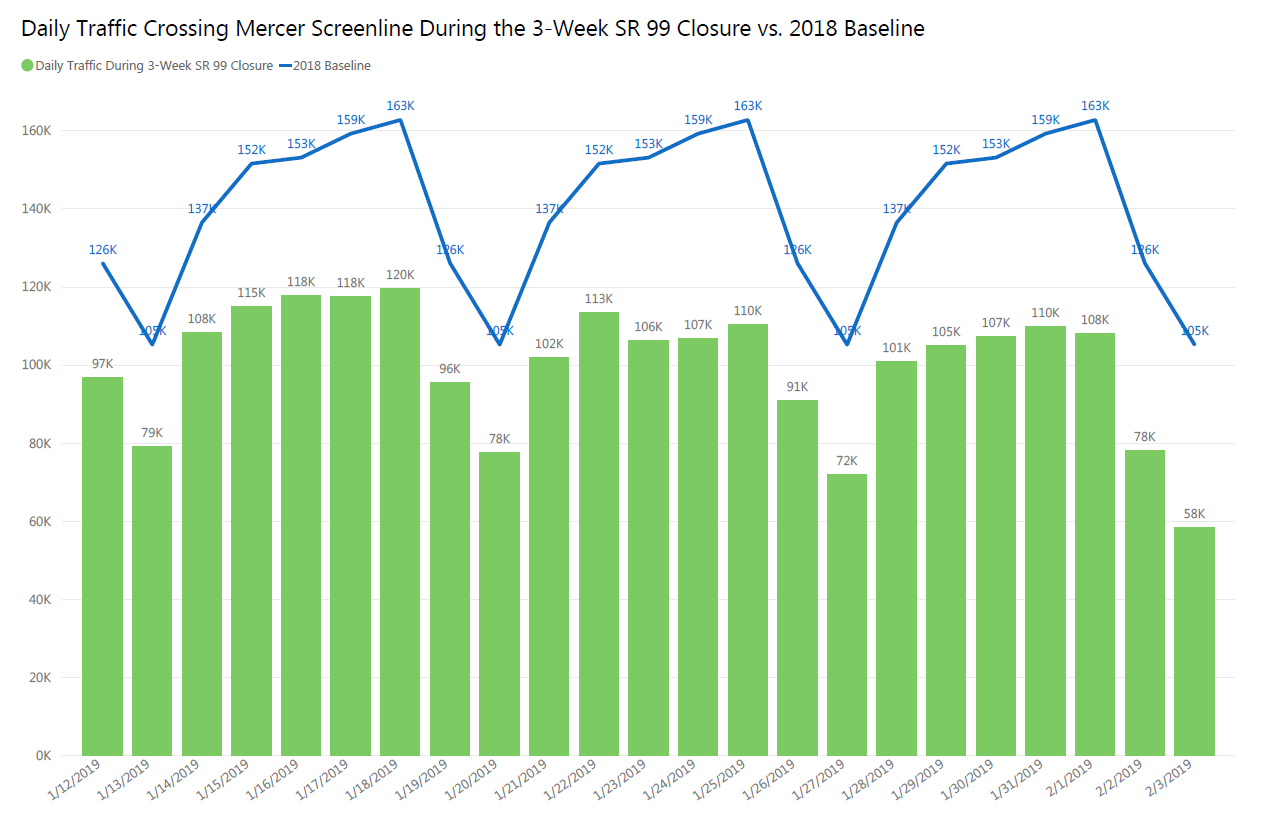
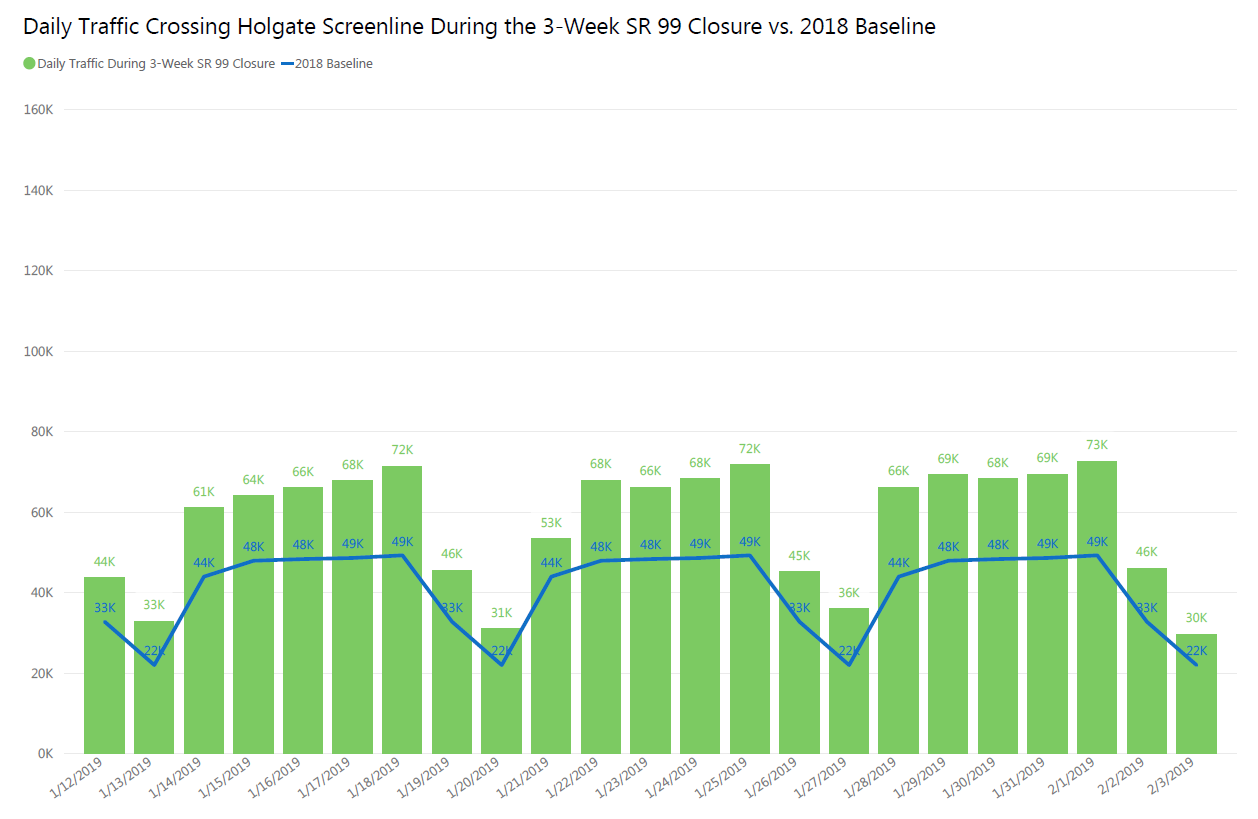
When you dive into the data further, you see that a decrease in volumes on Mercer Street helped offset increased volumes at S Holgate Street:
Good news: People took transit – and shifted their commute timing.
During the SR 99 closure, our partners at King County Metro tracked daily ridership along major corridors impacted, both from the North (Aurora, Dexter, 15th, and Westlake) and from the South (I-5 south of downtown and Viaduct routes operating on 1st and 4th). While the data reflects only those key corridors, it shows that King County Metro Transit ridership, including both buses and the West Seattle Water Taxi, varied during the closure, but increased during two of the three weeks compared to January 2018:
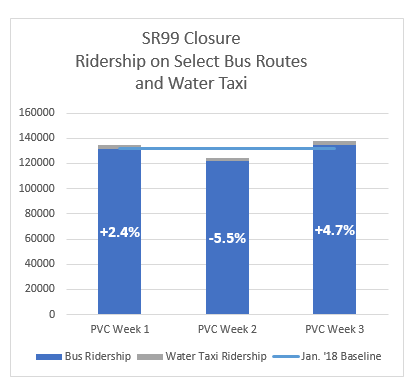
We also saw that during every week of the closure, the percent of riders during the midday was higher as compared to the same month last year. That means there was a shift in commute times out of the peak “rush hour” periods and towards the midday.
Sound Transit Link light rail ridership during the three-week viaduct closure was up 14 percent from last year, to more than 79,000 daily boardings. The Free Waterfront Shuttle ridership increased by 11 percent during this closure.
With a brief survey of employees from some of the largest downtown employers, we found that people used telecommuting as a great way to reduce commute trips downtown. These numbers also align with the reduction in total traffic coming downtown I mentioned earlier.
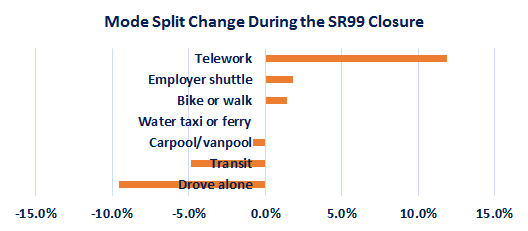
In the City of Seattle, we launched an Alternative Work Arrangement Pilot for Chapter 1 of the Seattle Squeeze. The City previously only had 12.5 percent of employees that had alternative work arrangements, which included telework or flexible work hours. The City now has 30 percent of City–wide employees participating in Alternative Work Arrangements and 38 percent in the downtown core.
Good news: People biked more.
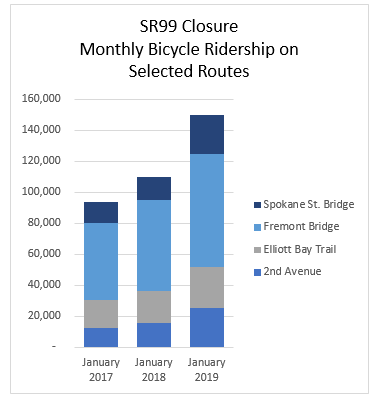
Another piece of good news we saw in the data is that there were increases of people biking to and through our downtown during the SR 99 closure as one part of the approximately 250,000 people who commute to and through downtown each day. Currently, approximately three percent of commuters to downtown Seattle bike.
To help understand how many people are biking in Seattle and seasonal variation, the City has installed bike counters at four key routes: the Spokane St. Bridge, the Fremont Bridge, the Elliot Bay Trail, and 2nd Avenue downtown. The data is clear: Compared to January 2018, there were approximately 40,000 additional trips in January 2018 at those locations (note: the data below represents one trip each way, and both privately owned bikes and bike share, for the full month):
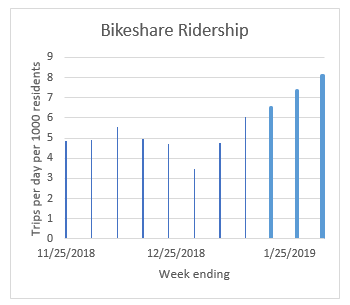
Ahead of the SR 99 closure, another step we had taken to give Seattleites more options for getting around and accessing transit was to expand and make permanent our free-floating bike share program. Our data shows that change paid off: we also saw a significant increase in people who used free-floating bike share.
What’s next? Chapter 2 of the Seattle Squeeze begins on March 23 – so please keep it up.
On March 23, the Downtown Seattle Transit Tunnel will become light rail only, and 830 more Metro buses a day will come onto Seattle’s streets. We call it the second chapter of the Seattle Squeeze. That means how we get around Seattle will continue to change – and it will be a challenge. Over the next several years, we are making changes to our City and to our regional transportation system to meet the needs of a growing region and help people get where they need to go safely and efficiently.
We’re continuing to work with our partners and do our part to keep people, goods, and transit moving. We’re taking steps like adding new bus-only lanes on 5th and 6th Avenues, and adding more transit service in both the peak and shoulder hours.
During this second chapter of the Seattle Squeeze, we need the public’s help to continue to make room on our roads and on transit. Please make your plan, and help us work together to make everyone’s commute easier. Let’s keep the momentum going and the good news coming. Visit www.seattle.gov/traffic to learn more and make your plan.